Case Study - Navigational Flow Chart - Work Request Form
The example above is an SVG export which means it is scaleable and editable. The graphic enlarges and reduces without losing quality when viewed in appropriate applications.
Case Study - Work Request Form - The Steps
FROM WORKING DRAFT

Designing a navigational flow chart is no mean feat and is best left to the planners. User experience is not high on the list when planning these organisational charts. I am presented with a fluid, ever-changing draft with many shapes and lines to decipher and asked to create something easy to follow.
TO WHERE IT NEEDS TO GO

The brief is vague and the timeframe is usually yesterday.
TO SIGN OFF

The final drawing satisfies the customer and corporate identity. Furthermore, the graphic is a scaleable non-degrading vector and can import into PDF, Powerpoint or Webpage.

ESTD 2016

Infographics


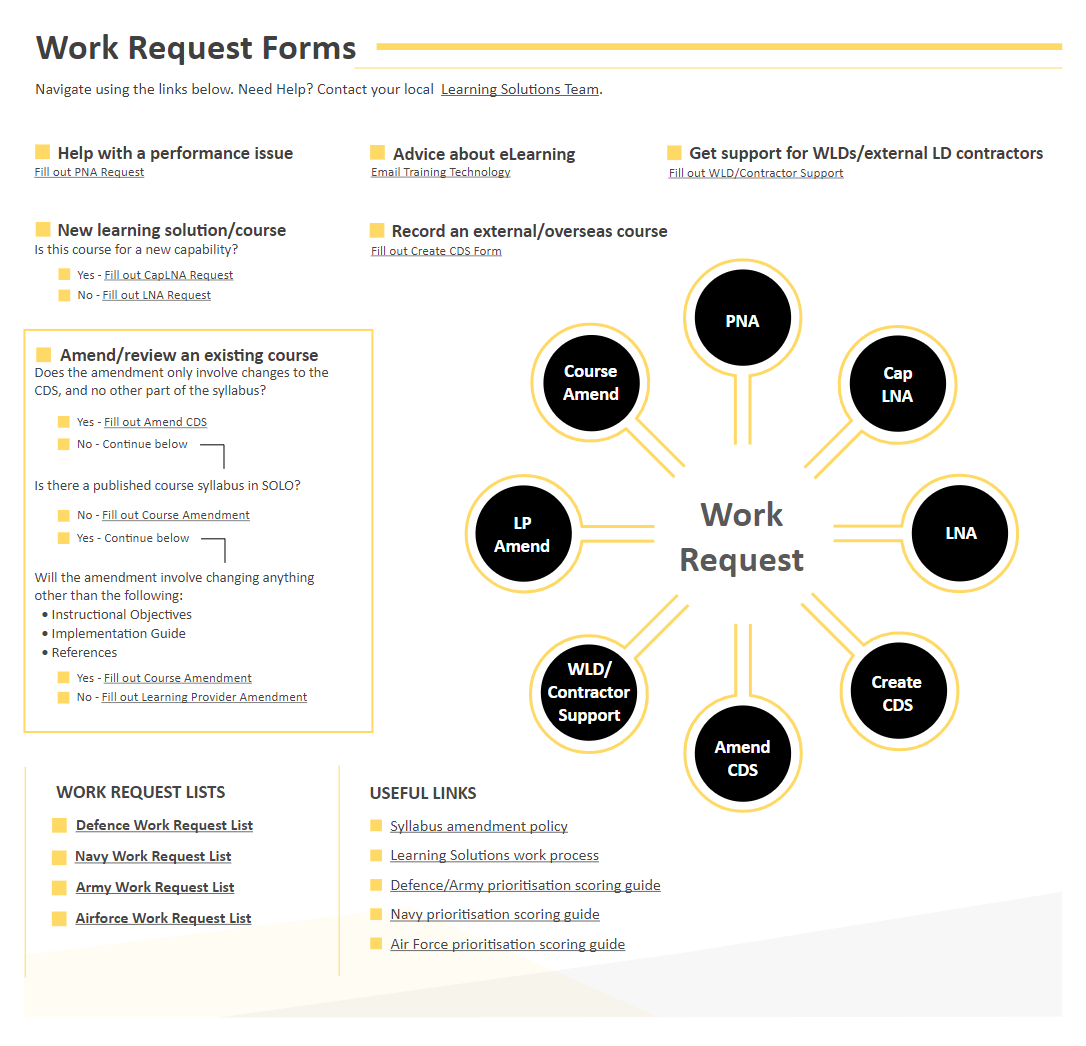
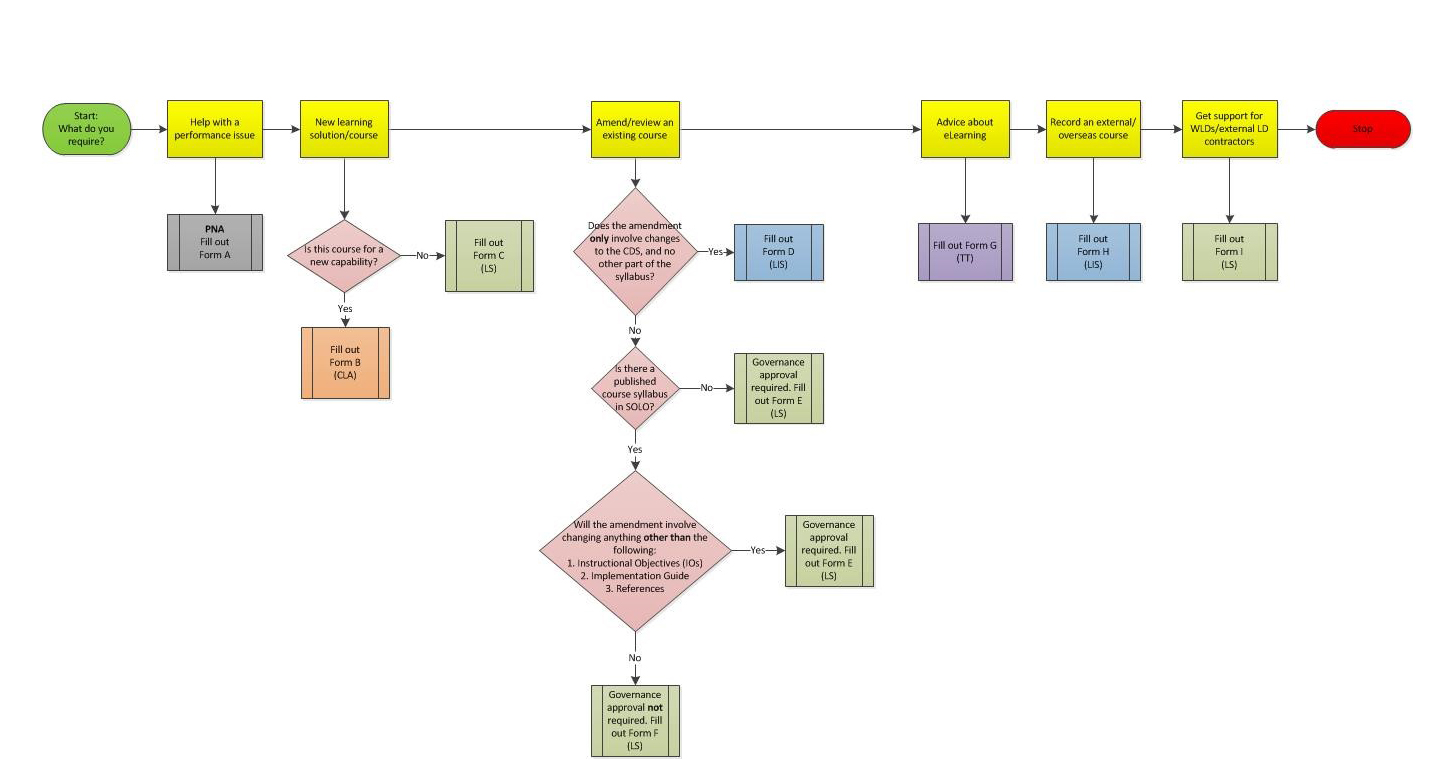
An infographic is a graphic used to communicate information, often information that is complex in some way. By using visuals, they help convey ideas in accessible, coherent, memorable, and compelling ways.


Data storytelling is an excellent technique for guiding your audience through information. Infographics are great storytelling mediums; good infographics tell stories that people remember and recall over time.


Create your infographic for your target audience. A good infographic is actionable.


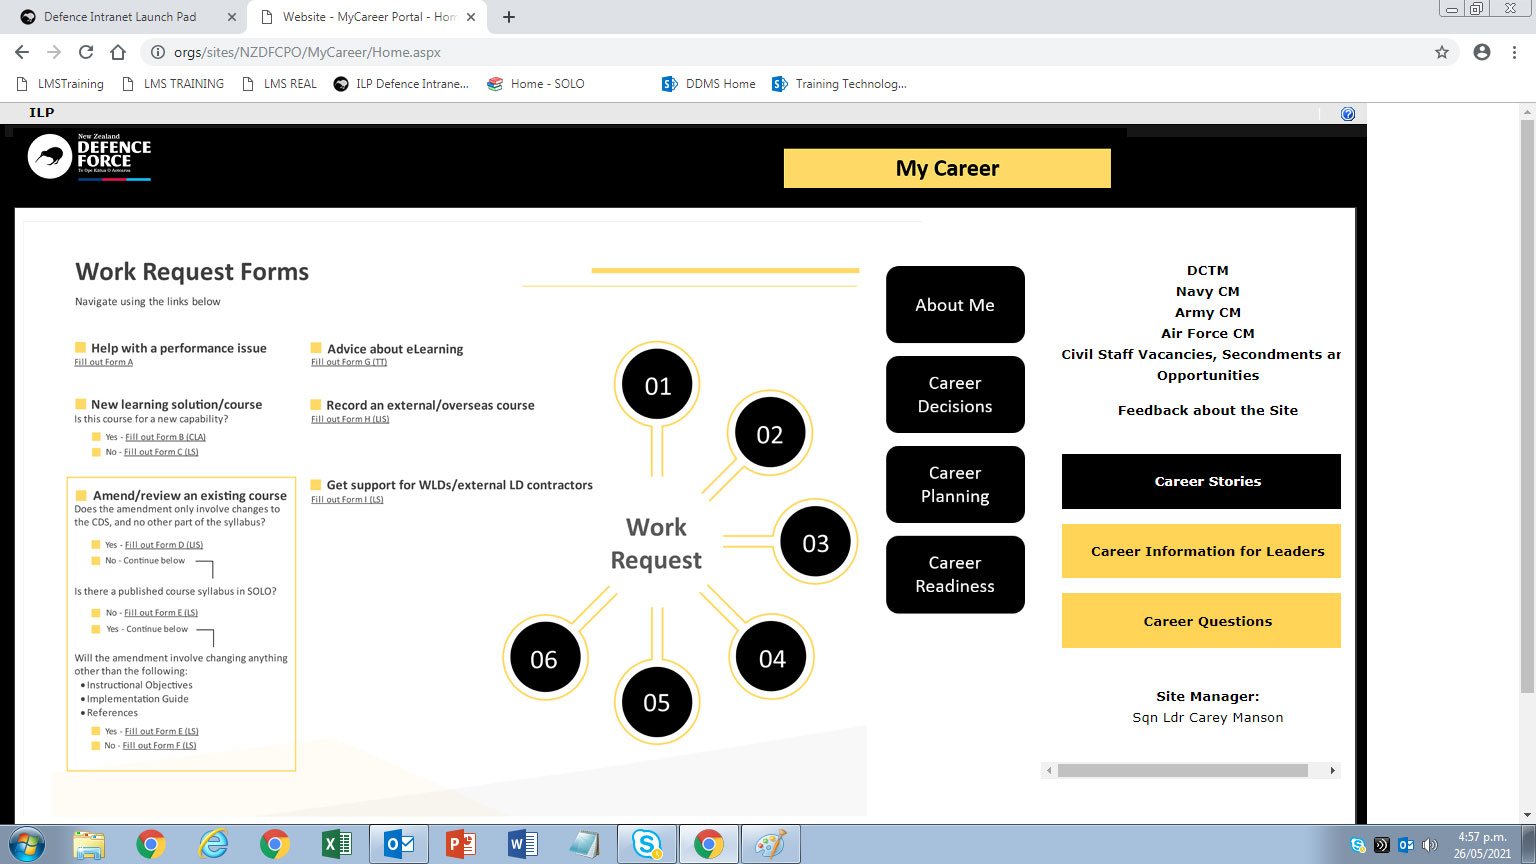
It is a good idea to have every element in the graphic mean something. If a component doesn't add to the flow of the story, remove it. Overloading your infographic with visual distractions or clutter is a no-no.


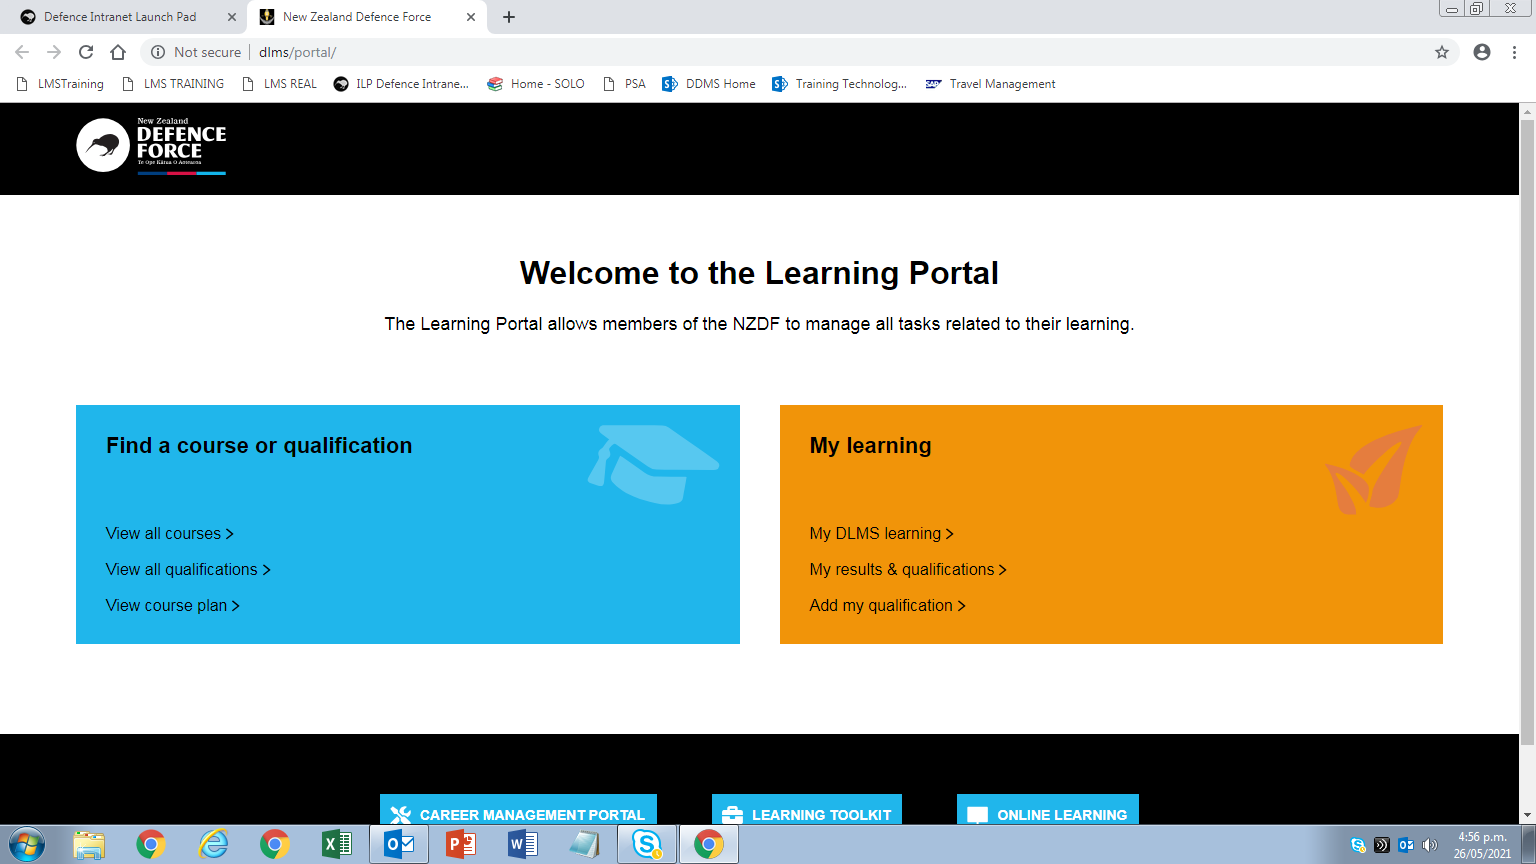
Infographics should not be:


  • Confusing or cluttered,
  • Beautiful but gratuitous,
  • Misleading or distracting.
FULL STORY
Evan Floyd Digital Training Multimedia Producer
Before starting your Blended Learning project, you must fill out a Project Initiation Document (PID) or a Work Order Request (WOR). However, feel free to contact me for some guidance towards some possible solutions to achieve your end goals.